


















.svg.png?height=48&name=Zoho_CRM_(application).svg.png)







Accounts receivable KPIs are the numbers that show how quickly your customers pay, how much of what they owe is late, and how well your team turns invoices into cash. The 10 worth tracking are days sales outstanding (DSO), average days delinquent, the collection effectiveness index (CEI), accounts receivable turnover, percent current, percent over 90 days past due, bad debt to sales, follow-up coverage, invoice accuracy, and cost of collections. Each one is a simple formula you can run from your aged receivables report and your sales ledger. What "good" looks like depends on your payment terms, so this guide gives you each formula, a worked number, the published benchmark where one exists, and a clear label where it doesn't.
It also covers how to turn these KPIs into goals for your accounts receivable team, what to review each week and each month, and where automation moves each number.
The short version
- Watch DSO, but judge your team on lateness. DSO moves with sales and payment terms. Average days delinquent, CEI, and percent over 90 days show how well collection is working.
- Compare against your own terms first. The National Association of Credit Management (NACM) says a DSO within roughly 20% of your best possible DSO points to healthy cash flow.
- Use published medians as a sense check, not a target. In the Credit Research Foundation's second-quarter 2026 survey of US companies, the median DSO was 37.5 days and the median CEI was 79.35.
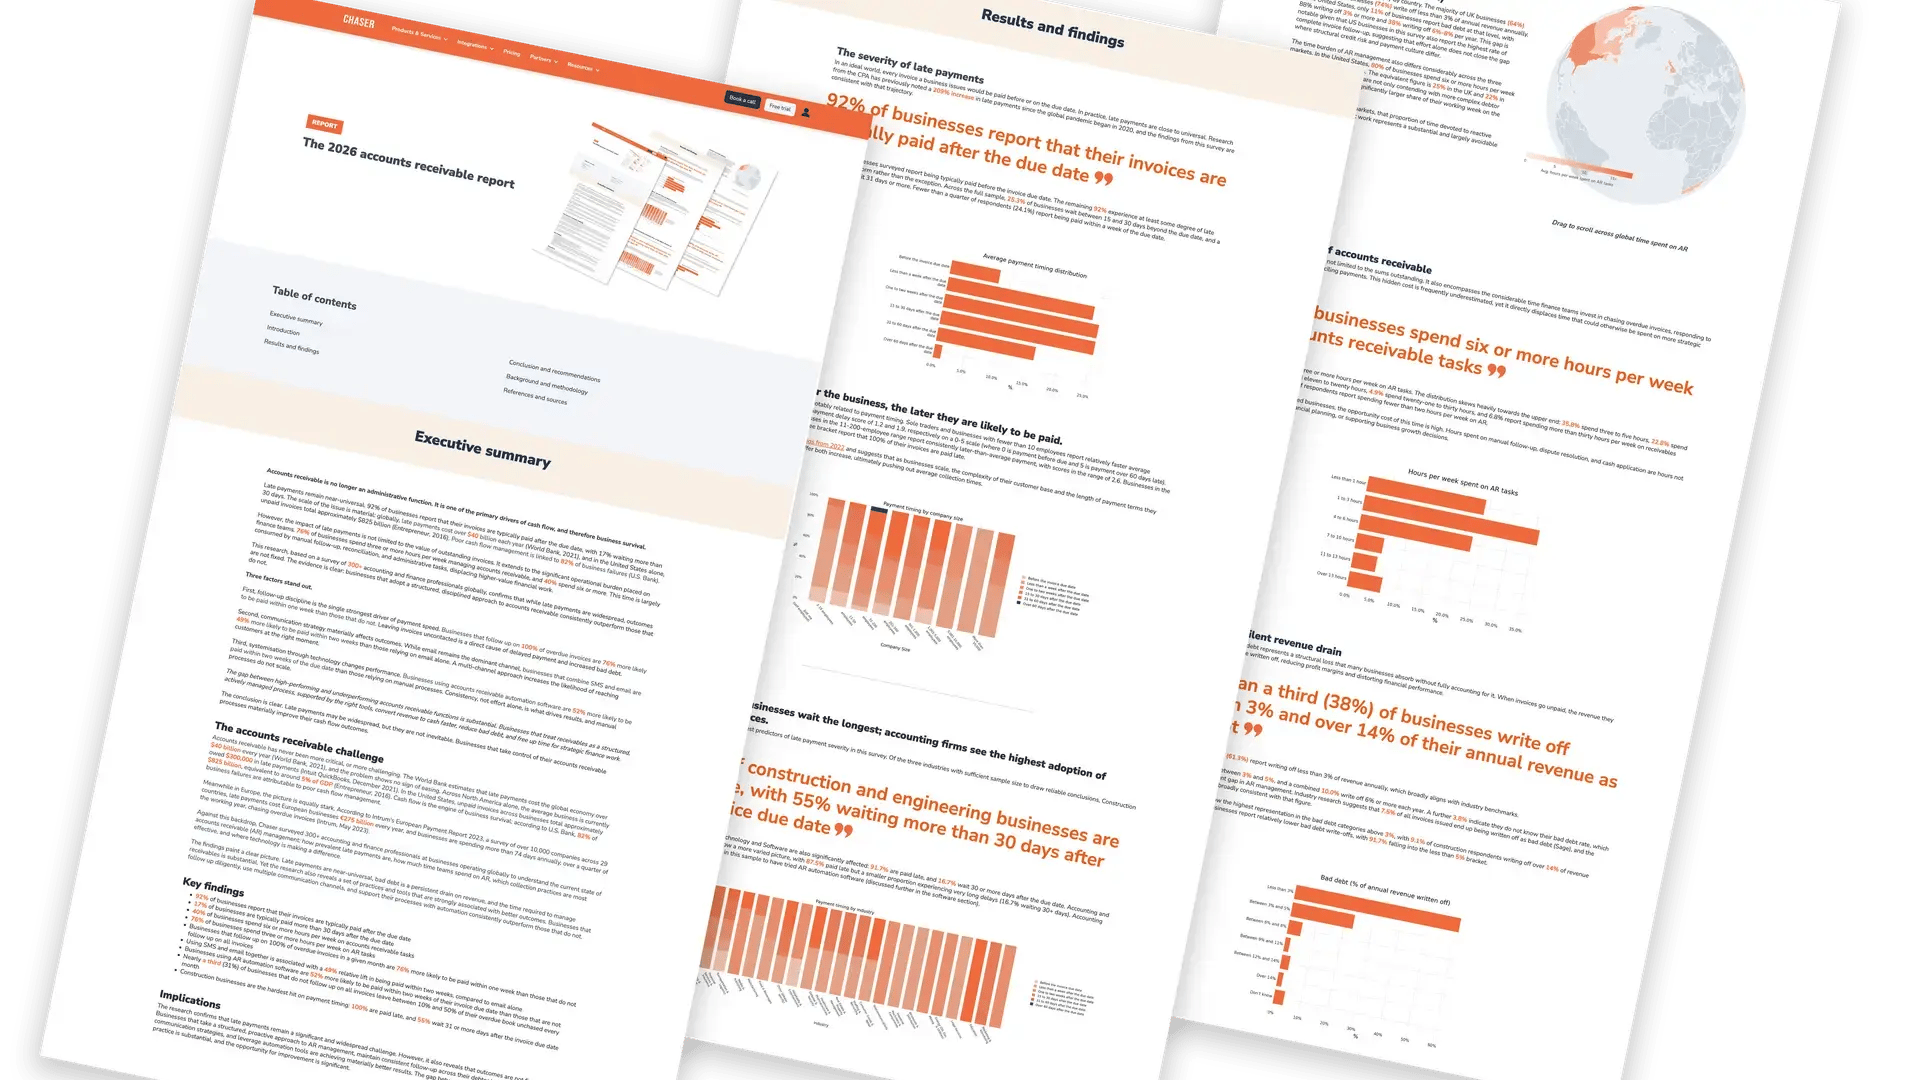
- Chase every overdue invoice. In Chaser's 2026 survey, 28% of businesses that follow up on all overdue invoices were paid within a week of the due date, against 16% of those that don't.
What are accounts receivable KPIs?
Accounts receivable (AR) KPIs are key performance indicators for the money your customers owe you. They measure three things: how long it takes to turn a sale into cash, how much of your ledger is overdue, and how efficiently your team collects it.
A KPI is only useful if it drives an action. NACM makes the same point in its 2023 white paper on measuring credit department performance: "Every metric should drive an action in the credit department, otherwise it is meaningless." So for each KPI below, you get the formula and the decision it should prompt.
All the worked numbers use one sample business, so you can follow how the KPIs relate to each other.
The sample business (all figures USD)
- Payment terms: 30 days. September has 30 days.
- Receivables on 1 September: $480,000 USD. Credit sales in September: $400,000 USD.
- Receivables on 30 September: $520,000 USD, of which $380,000 USD is not yet due (current) and $140,000 USD is overdue. $15,600 USD of that is more than 90 days past due.
- Last 12 months: $4,800,000 USD of credit sales, average receivables of $500,000 USD, $43,200 USD written off as bad debt, and $96,000 USD spent running AR and collections.
- In September the team issued 400 invoices and had 160 overdue invoices to chase.
The 10 accounts receivable KPIs at a glance
The formulas follow the Credit Research Foundation's performance measures and NACM's quick formulas where those exist. The last column shows a published benchmark where one exists, or says plainly that it is a rule of thumb or Chaser's own data.
| KPI | Formula | What it tells you | What good looks like |
|---|---|---|---|
| 1. Days sales outstanding (DSO) | Ending total receivables × days in period ÷ credit sales for the period | How many days of sales are tied up in unpaid invoices | Within about 20% of your best possible DSO, per NACM. CRF US median, Q2 2026: 37.5 days |
| 2. Average days delinquent (ADD) | DSO − best possible DSO, where best possible DSO = current receivables × days ÷ credit sales | How many of those days come from customers paying late | As low as possible. CRF US median, Q2 2026: 3.7 days |
| 3. Collection effectiveness index (CEI) | (Beginning receivables + credit sales − ending total receivables) ÷ (beginning receivables + credit sales − ending current receivables) × 100 | How much of what you could have collected, you did collect | The closer to 100, the better, per CRF. CRF US median, Q2 2026: 79.35 |
| 4. AR turnover and AR days | Net credit sales ÷ average receivables. AR days = 365 ÷ turnover | How many times a year your receivables turn into cash | AR days close to your average payment terms. Not comparable across industries, because terms differ, per NACM |
| 5. Percent current | Receivables not yet due ÷ total receivables | How much of your ledger is on time | Higher is better. CRF US median, Q2 2026: 87.9% |
| 6. Percent over 90 days past due | Receivables more than 90 days past due ÷ total receivables | How much of your ledger is at serious risk of becoming bad debt | CRF US median, Q2 2026: 0.40%. In Dun & Bradstreet's Q1 2026 data, only 16 of 203 US industry segments reach 10% or more |
| 7. Bad debt to sales | Bad debt written off, net of recoveries ÷ credit sales × 100 | How much revenue you never collect | Lower is better. Atradius, 2026: UK companies report bad debts of around 2% of B2B credit sales |
| 8. Follow-up coverage | Overdue invoices contacted in the period ÷ overdue invoices × 100 | Whether every late invoice is actually being chased | 100% every month. Chaser's own survey data links full coverage to faster payment |
| 9. Invoice accuracy | Accurate invoices ÷ total invoices issued × 100, per NACM | How many payments are delayed by your own errors | As close to 100% as you can get. Published benchmarks are scarce, so track your own trend |
| 10. Cost of collections | Total cost of AR and collections ÷ (revenue × 0.001), giving a cost per $1,000 USD of revenue, as APQC measures it | What it costs you to collect each $1,000 USD of revenue | Falling over time. APQC's benchmark data for this measure is available through its membership, so track your own trend |
A note on the benchmarks. The Credit Research Foundation (CRF) figures come from its quarterly survey of US domestic trade receivables, and each one is an independent median, so DSO minus best possible DSO won't exactly equal the median ADD. Treat them as a sense check for a US business. Your payment terms, sector, and customer mix matter more.
How to calculate each AR KPI, with a worked example
1. Days sales outstanding (DSO)
DSO is the average number of days it takes to turn a credit sale into cash. It is the KPI your CFO and board will ask for first.
Formula: ending total receivables × days in the period ÷ credit sales for the period.
Sample business: $520,000 × 30 ÷ $400,000 = 39 days.
On 30-day terms, a DSO of 39 tells you cash arrives later than your terms allow. The next KPI shows how much of that gap is lateness. DSO also moves when sales rise or fall, or when you change your terms, so don't read it alone. NACM's white paper on managing DSO describes it as "not always a good number to hold the credit team accountable." For the full method and more worked examples, see the DSO formula guide.
2. Average days delinquent (ADD) and best possible DSO
Best possible DSO is the DSO you would have if every customer paid exactly on time. Average days delinquent is the gap between that and your actual DSO. It isolates lateness, which is the part your team can change.
Formula: best possible DSO = current receivables × days in the period ÷ credit sales. ADD = DSO − best possible DSO.
Sample business: $380,000 × 30 ÷ $400,000 = 28.5 days. ADD = 39 − 28.5 = 10.5 days.
NACM's rule of thumb is that a DSO within roughly 20% of your best possible DSO means healthy cash flow. For the sample business, that line is 28.5 × 1.2 = 34.2 days. A DSO of 39 is about 37% above best possible DSO, so there is room to improve. NACM also notes that ADD and DSO should almost always move in the same direction. If they don't, your terms or sales have probably changed, rather than your team's performance. The average days delinquent guide covers ways to reduce it.
3. Collection effectiveness index (CEI)
CEI compares what you collected in a period with what you could have collected. The CRF describes it as a measure of "the effectiveness of collection efforts over time", where "the closer to 100 percent, the more effective the collection effort is."
Formula: (beginning receivables + credit sales − ending total receivables) ÷ (beginning receivables + credit sales − ending current receivables) × 100. For a period longer than a month, the CRF divides credit sales by the number of months.
Sample business: ($480,000 + $400,000 − $520,000) ÷ ($480,000 + $400,000 − $380,000) = $360,000 ÷ $500,000 = 72.
A CEI of 72 means the team collected 72% of what was collectible in September. That is below the CRF's second-quarter 2026 median of 79.35. The collection effectiveness index guide walks through more examples.
4. Accounts receivable turnover and AR days
AR turnover counts how many times a year you collect your average receivables balance. AR days, also called the average collection period, turns that into days.
Formula: net credit sales ÷ average receivables. AR days = 365 ÷ turnover.
Sample business: $4,800,000 ÷ $500,000 = 9.6 times a year. 365 ÷ 9.6 = 38 days, close to the 39-day DSO, as you'd expect when sales are steady through the year.
Use a full year of sales against an average balance for the same year. If you divide one month's sales by the average balance and then use 365, you'll overstate AR days roughly twelvefold. NACM warns against comparing turnover across industries, because terms differ: a business on 60-day terms will always turn slower than one on 14-day terms. See how to calculate AR turnover and the average collection period formula for more.
5. Percent current
Percent current is the share of your receivables that isn't due yet. The CRF calls it "a quick check-up on the relative condition of receivables."
Formula: current receivables ÷ total receivables.
Sample business: $380,000 ÷ $520,000 = 73% current, so 27% is overdue.
The CRF's US median for the second quarter of 2026 was 87.9% current. For UK context, Atradius's 2026 UK survey found that late payments affect about 25% of invoiced B2B turnover, on payment terms that most companies anchor at about 30 days.
6. Percent over 90 days past due
This is the share of your ledger that is more than 90 days late. It is your early warning for bad debt.
Formula: receivables more than 90 days past due ÷ total receivables.
Sample business: $15,600 ÷ $520,000 = 3.0%.
The CRF's US median was 0.40% in the second quarter of 2026. In Dun & Bradstreet's Q1 2026 US accounts receivable report, only 16 of 203 industry segments had 10% or more of their aging dollars more than 90 days past due. So 3.0% is far from the worst cases, but it is high against the CRF median. Your aged receivables report shows you which customers make up the balance.
7. Bad debt to sales
Bad debt to sales shows how much of what you sell on credit you never collect.
Formula: bad debt written off, net of recoveries ÷ credit sales × 100.
Sample business: $43,200 ÷ $4,800,000 = 0.9%.
Atradius found that UK companies report bad debts of around 2% of B2B credit sales in 2026. In Chaser's 2026 accounts receivable report, 61.3% of businesses said they write off less than 3% of revenue a year, and 3.8% didn't know their bad debt rate at all. If that is you, start here. For how to estimate and book it, see how to calculate bad debt expense.
8. Follow-up coverage
Follow-up coverage is the share of overdue invoices your team actually contacted in the period. It is the simplest KPI on this list and one of the most telling, because an invoice nobody chases is an invoice that waits.
Formula: overdue invoices contacted in the period ÷ overdue invoices × 100.
Sample business: 136 ÷ 160 = 85%. 24 overdue invoices got no contact in September.
This KPI comes from Chaser's own research rather than a standards body. In Chaser's 2026 survey, 28% of businesses that follow up on all their overdue invoices each month were paid within one week of the due date, compared with 16% of those that don't. Yet 31% of businesses admitted leaving some overdue invoices uncontacted.
9. Invoice accuracy
Invoice accuracy counts how many invoices go out right the first time. A wrong price, a missing purchase order number, or the wrong contact all give a customer a reason not to pay yet.
Formula: accurate invoices, meaning those issued without a correction or credit note ÷ total invoices issued × 100.
Sample business: 388 ÷ 400 = 97%. 12 invoices needed a correction or credit note.
Log the reason for every correction or dispute. The pattern tells you whether to fix pricing, purchase order checks, or delivery confirmation. The guide to common invoice disputes and how to resolve them covers the usual causes.
10. Cost of collections
Cost of collections shows what you spend to collect your revenue, including people, software, and outside services. APQC, the benchmarking body, measures it as total cost per $1,000 of revenue in its AR and collections measure list.
Formula: total cost of AR and collections ÷ (revenue × 0.001).
Sample business: $96,000 ÷ 4,800 = $20.00 USD per $1,000 USD of credit sales.
Track it alongside the KPIs above. A falling cost is only good news if ADD and percent over 90 days hold steady or improve at the same time.
What the sample business should do next
Read together, the 10 KPIs tell one story. DSO is 39 days on 30-day terms, ADD is 10.5 days, CEI is 72, and 24 overdue invoices got no contact this month. The problem is follow-up, not terms. Each day of sales is worth $400,000 ÷ 30 = about $13,333 USD, so bringing DSO down to NACM's healthy line of 34.2 days would release about 4.8 × $13,333 = $64,000 USD of cash. The first step is to reach 100% follow-up coverage, then work the 3.0% over 90 days account by account.
Track these KPIs in a free spreadsheet
Chaser's accounts receivable KPI tracker is a Google Sheet with ready-made formulas for six of these KPIs: DSO, average days delinquent with best possible DSO, AR turnover with AR days, CEI, bad debt to sales, and the write-off ratio. Fill in a short form to get the link. The sheet opens as view-only, so make your own copy with File, then Make a copy. To use it in Excel, choose File, then Download, then Microsoft Excel.
How to set AR KPI targets
A KPI without a target is a number you look at. A target turns it into a decision. Set targets in three steps.
- Start from your own history. Take the last 6 to 12 months of each KPI and find your typical level and your best month. The State of Oregon's guidance for its agencies' receivables makes the same point: targets "should be established based on historical data," then reviewed when things change.
- Anchor to your terms. Your best possible DSO tells you what perfect looks like for your terms. Use NACM's 20% rule to set a realistic DSO line above it. The Hackett Group warns that setting a target DSO equal to best possible DSO "is not realistic though, unless the company has a very limited number of bad paying customers."
- Sense-check against published benchmarks. Use the CRF medians, the Atradius data for your country, and your sector's figures to see whether your targets are ambitious or comfortable. Don't copy a benchmark directly, because your terms and customers are your own.
Accounts receivable team goals and performance review examples
Not every KPI belongs in a person's goals. Some are driven by sales, pricing, and terms that your AR team doesn't control. The CRF notes that CEI "can be used as a departmental or individual performance measure," and that ADD and percent over 91 days can evaluate individuals and groups. NACM is clear that DSO is a company number first.
| Role | KPIs to own | KPIs to watch, not own |
|---|---|---|
| Accounts receivable specialist | Follow-up coverage, ADD and percent over 90 days for their own customers, dispute resolution time | Company DSO, bad debt to sales |
| Finance manager | CEI, ADD, percent current, percent over 90 days, invoice accuracy, cost of collections | DSO and AR turnover, which also depend on sales and terms |
| Head of finance or CFO | DSO against target, bad debt to sales, cost of collections | Team-level KPIs, through the finance manager's monthly report |
Example goals for an accounts receivable specialist
Write each goal so it is specific, measurable, within the person's control, and time-bound. These examples use the sample business. Adjust the numbers to your own history.
- Contact 100% of overdue invoices in your customer group every month for the next quarter, up from 85% in September.
- Reduce average days delinquent for your customers from 10.5 to 7.5 days by 31 December.
- Bring receivables over 90 days in your customer group below 2% by the end of the quarter, with a documented action on every account above that line.
- Log a reason for every dispute on the day it arrives, and agree a resolution date with the customer.
Example goals for a finance manager
- Raise CEI from 72 to 80 over the next two quarters, in line with the CRF's US median of 79.35.
- Bring DSO down from 39 days to 34 days, just inside NACM's healthy line of 34.2 days for a best possible DSO of 28.5 days, by the end of the fiscal year.
- Raise invoice accuracy from 97% to 99% by fixing the two most common correction reasons.
- Hold cost of collections at or below $20.00 USD per $1,000 USD of credit sales while the KPIs above improve.
Performance review examples
In a review, pair each number with what the person did to move it. That keeps the conversation on behavior, not only on results the team can't fully control.
- Exceeds: "Kept follow-up coverage at 100% for all three months of the quarter and cut average days delinquent on your customers from 10.5 to 7 days. Escalated two long-overdue accounts early, which kept over-90-day debt below 2%."
- Meets: "Reached 100% follow-up coverage in two of three months. Average days delinquent held steady. Next quarter, focus on the five largest overdue accounts first each week."
- Needs support: "Follow-up coverage averaged 80%, and receivables over 90 days rose. Let's look at the workload together and agree which reminders can run automatically."
How often to review AR KPIs
Different KPIs move at different speeds. Review the fast ones weekly and the structural ones monthly or quarterly. Keep your formulas the same from period to period, or the trend means nothing.
| Cadence | Who | KPIs | The question it answers |
|---|---|---|---|
| Weekly | AR specialists with the finance manager | Follow-up coverage, movement in percent over 90 days, open disputes | Is every late invoice being chased, and which accounts need a call this week? |
| Monthly | Finance manager with the head of finance | DSO, best possible DSO, ADD, CEI, percent current, invoice accuracy | Is collection getting better or worse, and is the cause lateness, terms, or sales? |
| Quarterly | Head of finance or CFO | AR turnover, bad debt to sales, cost of collections, targets for next quarter | Are credit policy and team resources right for where the business is going? |
From spreadsheet to dashboard
Most teams start in a spreadsheet. Export your aged receivables and sales each month, run the formulas, and keep a history tab so you can see the trend. The free KPI tracker gives you the formulas for six of the KPIs above.
Once the numbers are in place, the next step is a one-page view you can read in a minute. Chaser's free accounts receivable dashboard template puts DSO, average days delinquent, overdue balances by age, and your largest customers side by side.
The limit of any spreadsheet is that it is only as current as your last export. If your team spends hours each week rebuilding the same numbers, that time is better spent chasing the invoices behind them.
Where automation moves each KPI
Finance teams spend around 14 hours a week managing receivables manually, according to Intuit. Automation gives that time back and moves the KPIs that depend on consistent follow-up.
| KPI | The outcome you want | How Chaser helps |
|---|---|---|
| Follow-up coverage | Every overdue invoice chased, every month, without anyone remembering to do it | Reminder schedules by email, SMS, automated calls, and letters, based on due dates and customer groups |
| ADD and DSO | Customers pay closer to the due date | A payment portal link in every reminder, so customers can pay instantly, and a monthly DSO report for the last six months |
| CEI and percent over 90 days | The right accounts get attention first | Payer ratings that show which customers are most likely to pay late, and escalation to debt collection from inside the app |
| Bad debt to sales | Fewer risky customers on credit in the first place | Credit reports and monitoring before and after you extend credit |
| Cost of collections | The same results with less manual work | A time saved metric on your dashboard, plus the share of overdue invoices paid, so you can see the effect |
Move your AR KPIs without more manual work
Chaser connects to your accounting system, chases every overdue invoice with polite, personalized reminders, and shows your DSO and collection results in one place.
Start your free trial Book a demoFAQs
What are the KPIs for accounts receivable?
The 10 most useful are days sales outstanding, average days delinquent, the collection effectiveness index, AR turnover, percent current, percent over 90 days past due, bad debt to sales, follow-up coverage, invoice accuracy, and cost of collections. Together they show how fast you get paid, how much is late, and how well your team collects.
What are the top 3 accounts receivable KPIs?
If you track only three, choose DSO, average days delinquent, and the collection effectiveness index. DSO shows how long cash is tied up, average days delinquent shows how much of that is lateness, and CEI shows how much of what was collectible you actually collected.
What are the 5 key performance indicators for accounts receivable?
A strong set of five is DSO, average days delinquent, the collection effectiveness index, percent over 90 days past due, and bad debt to sales. They cover speed, lateness, collection effort, risk, and losses, and each can be calculated from your aged receivables report and sales ledger.
What is a good DSO?
A good DSO is close to your payment terms. NACM says a DSO within roughly 20% of your best possible DSO points to healthy cash flow. For context, the Credit Research Foundation's median DSO for US companies was 37.5 days in the second quarter of 2026.
What is the 10 rule for accounts receivable?
There is no official "10 rule". The phrase is used for two rules of thumb: keep receivables over 90 days past due below 10% of the total, or expect an overdue invoice to lose about 10% of its collectible value for each month it stays unpaid. Treat both as rules of thumb, not standards. The Credit Research Foundation's US median for receivables over 90 days was 0.40% in the second quarter of 2026.
How do you measure accounts receivable performance?
Measure it with a small set of KPIs calculated the same way every month, then compare each one with your own history and your payment terms. Start with DSO, best possible DSO, average days delinquent, and the collection effectiveness index, and add percent over 90 days and bad debt to sales.
What are good goals for an accounts receivable specialist?
Good goals are specific, measurable, and within the specialist's control. Examples are contacting 100% of overdue invoices every month, reducing average days delinquent for their customers by three days in a quarter, keeping receivables over 90 days below an agreed level, and logging a reason for every dispute on the day it arrives.
How often should you review AR KPIs?
Review follow-up coverage, overdue movement, and open disputes weekly. Review DSO, best possible DSO, average days delinquent, CEI, and percent current monthly. Review AR turnover, bad debt to sales, cost of collections, and your targets quarterly.
Benchmarks checked against the Credit Research Foundation, NACM, Dun & Bradstreet, Atradius, The Hackett Group, and Chaser's 2026 accounts receivable report on 3 October 2026. The CRF figures are updated each quarter. Last reviewed 3 October 2026.