
If you've ever tried to benchmark your accounts receivable (AR) performance and found yourself wading through figures that don't quite match your business, you're not alone. Most AR statistics in circulation were not collected with mid-market B2B teams in mind. They lack the industry breakdowns, geographic context, and operational detail that make a number actually useful.
This article draws its statistics from Chaser's 2026 Accounts Receivable Report, based on primary research with more than 300 finance professionals surveyed across the UK, US, and Australia. The findings are broken down by industry, geography, company size, and AR practice, which means the numbers here reflect how businesses like yours actually operate.
The statistics are organised into seven categories: late payments, time costs, follow-up behaviour, payment channels, bad debt, industry variation, and automation adoption. Navigate directly to the section most relevant to your situation.
Late payment statistics
1. 92% of businesses are typically paid after their invoice due date. That figure has worsened from 87% in 2022. For most businesses selling on credit terms, late payment is not the exception; it’s the default.
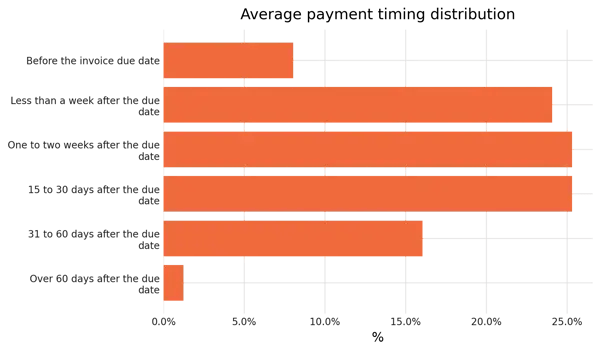
2. Fewer than one in four businesses are typically paid within a week of the invoice due date. For most, the waiting extends well beyond that point. 25.3% of businesses report receiving payment 15 to 30 days after the due date, and a further 17.2% wait 31 days or more. Those two buckets alone account for the majority of the B2B payment reality.
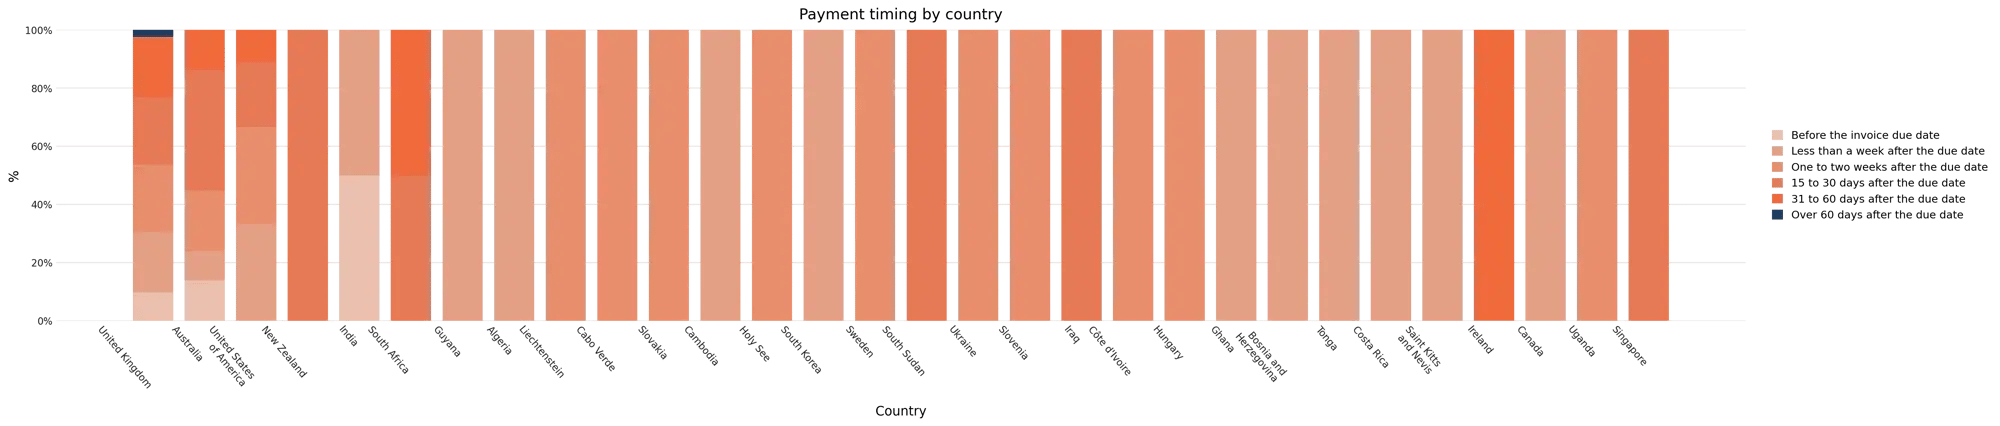
3. Late payment rates have worsened year-on-year. The UK (90%) shows particularly acute rates, consistent with broader industry data, which regularly places UK B2B payment terms compliance among the lower-performing markets in Europe. Australian (86%) and US respondents report comparable patterns: invoice due date breaches are the norm, not the exception, in all three markets.
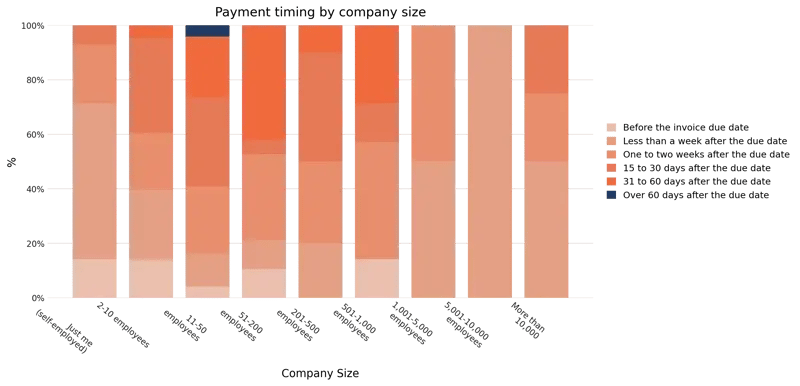
4. Smaller businesses experience longer average collection periods than those with dedicated credit control functions. The gap is not primarily explained by customer type, but by process consistency: without structured follow-up, reconciliation, or administrative tasks, late payers have room to slide. For finance managers working to contextualise their own days' sales outstanding (DSO) figure, every additional day of payment lag beyond terms extends the cash conversion cycle and directly compounds working capital pressure.
The time cost of AR management
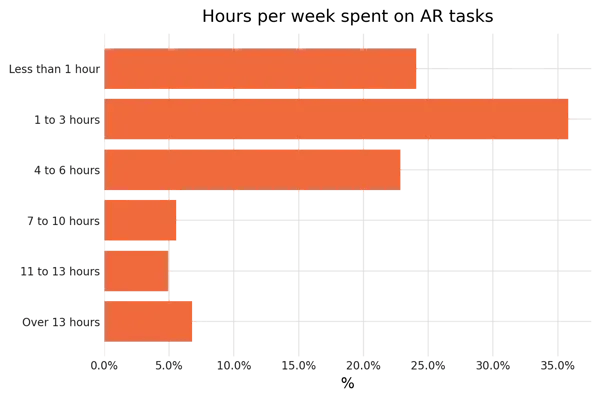
5. 40% of businesses spend six or more hours per week on AR-related tasks. That figure covers the full scope of accounts receivable management: drafting and sending reminders, reconciling payments, handling disputes, logging call notes, updating spreadsheets, and following up on follow-ups.
6. At a standard working week of 37.5 hours, six hours represents more than 15% of total working capacity. For a finance team where AR sits alongside month-end close, reporting, payroll, and supplier payments, that is a material drain that compounds across the year.
7. The time burden falls disproportionately on smaller teams. Average hours spent on AR tasks skew higher in teams of one to three people than in businesses with a standalone collections function. In many small businesses, a finance manager or director absorbs this workload directly alongside strategic responsibilities.
8. The time cost is largely invisible on a profit and loss statement. Unlike bad debt, staff time spent on AR tasks does not appear as a named line item. Six or more hours of finance professional time per week represents a meaningful annual staff cost that rarely surfaces in operational reviews, making it one of the hardest costs to build a business case around, even though it is one of the most consistent.
Follow-up behaviour and chasing patterns
9. 31% of businesses leave some invoices unchased every month. That means nearly a third of finance teams, knowing an invoice is overdue, take no action on at least part of their ledger. The reasons are familiar: the invoice feels awkward, the customer relationship is sensitive, the team is stretched, or the amount does not seem worth the friction.
10. Businesses that follow up on 100% of their overdue invoices are 76% more likely to be paid within a week than those that do not. Consistent follow-up is not just good practice. It is the single highest-leverage action in the collections process, and it requires no new technology to implement.
11. According to the report, email remains the primary channel for AR follow-ups, used by 91% of survey participants. Personal phone calls rank as the second most prevalent technique at 56%, while other digital channels see less frequent adoption: SMS payment reminders are employed by 23%, WhatsApp by 15%, and LinkedIn by 10% of organisations.
12. Consulting firms show the highest level of follow-up strictness, with 93% chasing every overdue invoice monthly. Despite this discipline, the industry still faces a 100% late payment rate, with 47% of businesses waiting at least 15 days past the due date to receive funds.
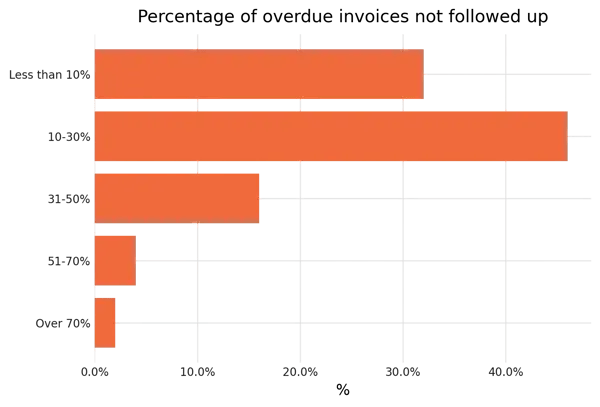
13. A significant portion of businesses fail to follow up on overdue invoices regularly. Specifically, 31% do not act on all overdue invoices each month, with notable gaps in follow-up efforts. Among them, 46% leave between 10% and 30% of overdue accounts unaddressed. Another 16% neglect 31% to 50%, while 2% do not follow up on more than 70% of their overdue invoices at all.
Payment channel statistics
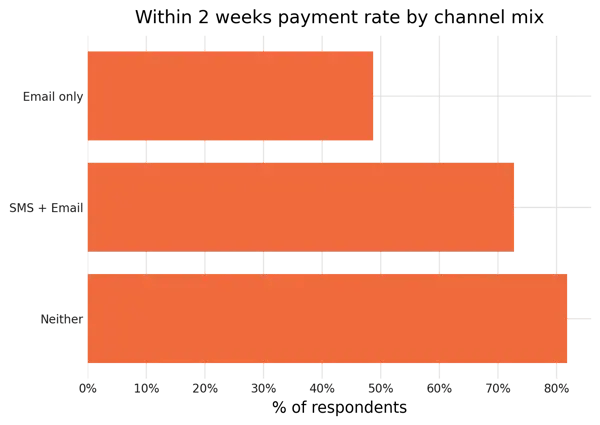
14. Late payment reminder emails are the most commonly used chasing channel, but it’s not necessarily the most effective. This surfaces a meaningful gap between channel usage (how often a channel is deployed) and channel effectiveness (how often it results in payment). Businesses that combine email and SMS are 49% more likely to be paid within 2 weeks.
15. Phone calls are consistently reported as an effective single escalation lever, used by 56% of businesses. This is particularly true for higher-value invoices where the debtor is a known contact. Adding a phone touchpoint after an unanswered email materially improves collection outcomes, according to the research.
16. Multi-channel follow-ups are considerably more effective than single-channel. Businesses using both SMS and email are paid within two weeks 73% of the time, compared to 49% for email alone.
Bad debt and write-off rates
17. 38% of businesses write off between 3% and over 14% of annual revenue as bad debt. This represents a significant proportion of earned revenue that never reaches the bank account. Where a business sits within that range depends heavily on the sector and on the consistency of its collection process.
18. 9.1% of construction businesses write off more than 14% of annual revenue as bad debt. That reflects both the project-based billing structure of the sector and the relative power of large contractors over smaller subcontractors. It is the highest rate of any sector covered in the 2026 research.
.webp?width=600&height=419&name=bad%20debt%20(%25%20annual%20revenue%20written%20off).webp)
19. 91.7% of IT and software businesses write off less than 5% of annual revenue as bad debt. Automated billing, higher average credit quality, and shorter payment cycles all contribute to a considerably lower write-off rate than the cross-sector average.
20. Sector context matters more than the cross-industry average. Where a business's bad debt rate sits relative to its sector is the meaningful comparison, not the average across all industries. For guidance on managing write-off risk before accounts reach that point, the Chaser guide on uncollectible accounts sets out a practical framework.
21. A business writing off 5% of revenue annually is effectively operating on a revenue base 5% smaller than its gross billings. The impact on margins compounds further when the staff time spent attempting recovery before the write-off decision is factored in.
22. Write-off rates for bad debt demonstrate significant geographical disparities. In the UK and Australia, most companies (64% and 74%, respectively) write off less than 3% of their yearly revenue. On the other hand, only 11% of US-based businesses achieve this low level of bad debt, with 88% reporting write-offs of 3% or higher and 38% losing between 6% and 8% annually.
AR performance by industry
23. Businesses in the UK and Australia show nearly identical average payment delay scores, recorded at 2.32 and 2.31. High rates of late payments persist in both regions, with 90% of UK invoices and 86% of Australian invoices being settled after the due date. The data reveals that payments in both markets are heavily concentrated in the 15-30 and 31-60 day post-due intervals, indicating that delayed settlements are a structural norm in these business environments.
24. Construction and engineering have the worst payment timing of any sector — 100% paid late, with the longest delays in the research. Extended payment terms, project-based billing, and contractor-subcontractor payment dynamics all contribute.
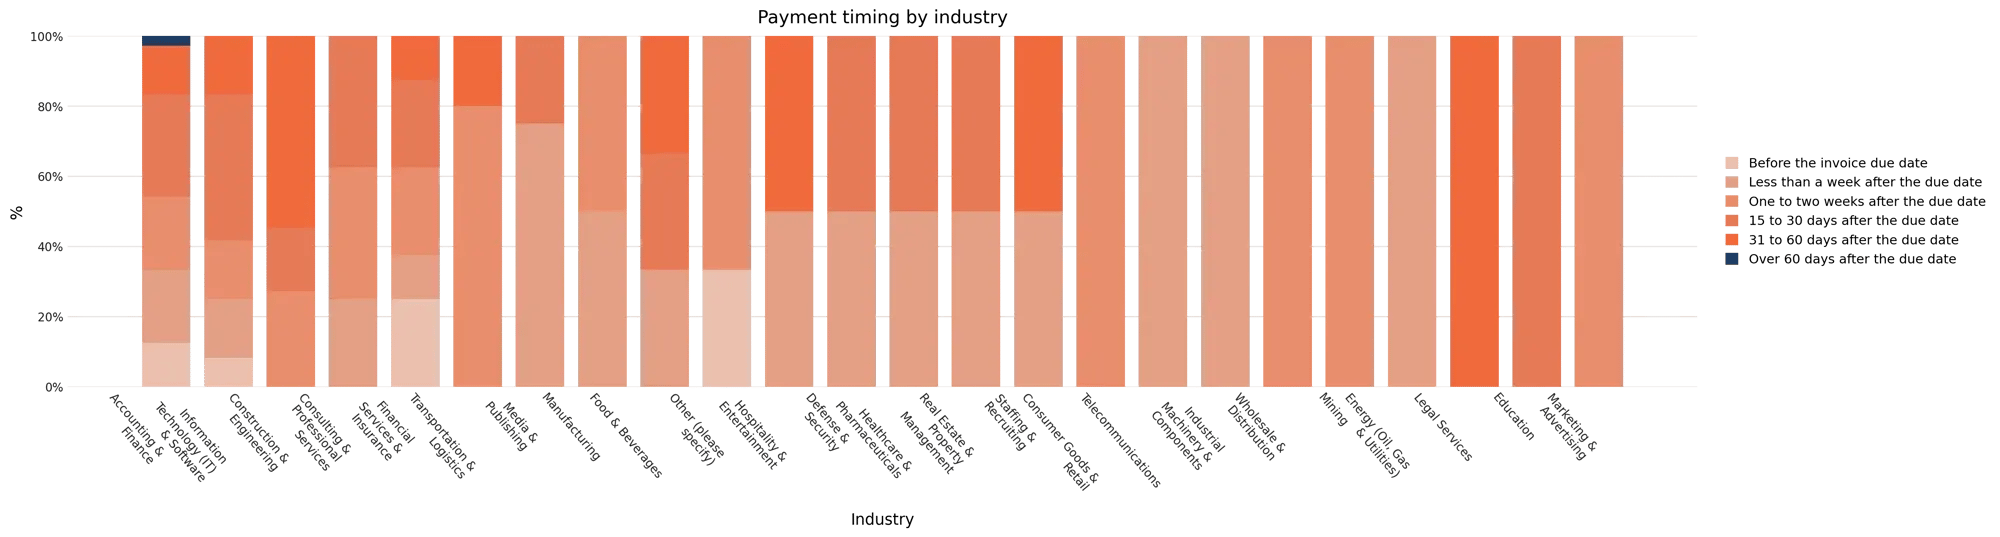
25. The working capital management implications for construction businesses are acute. 55% of construction businesses are forced to wait for 31 or more days after the date. Longer average collection periods mean more cash tied up in receivables, and the margin profile of many construction businesses leaves little room to absorb it.
26. Recruitment and staffing show elevated late payment rates of 50% relative to stated terms. This reflects a sector where the value of services is often delivered before payment is due and where payment disputes frequently arise from timesheet or placement fee disagreements.
27. Accounting and finance show the widest distribution of any sector covered. 87.5% paid late, but a smaller proportion experienced very long delays, with 16.7% waiting 30+ days. Firms with strong credit policies and consistent follow-up processes report DSO figures close to terms. Those without show significant tail risk in their aged debt. The variance within the sector is larger than the variance between sectors in some cases.
28. 12% of accounting firms are paid before the due date. The industry sits at the better-performing end of the distribution for both late payment frequency and bad debt write-off rates. Subscription and SaaS billing models reduce payment term uncertainty, and the relatively high creditworthiness of the typical customer base reduces default exposure.
AR automation adoption
29. Businesses using AR automation software are 52% more likely to be paid within two weeks than those relying on manual processes. The gap is not explained by customer base or payment terms, but by consistency: automated processes follow up on every invoice, on schedule, without the volume and capacity constraints.
30. A significant proportion of finance teams’ time is spent primarily on manual AR processes. Spreadsheets, calendar reminders, and ad-hoc email follow-up remain common. An Emagia report suggests integration complexity, uncertainty about setup time, and difficulty calculating return on investment before committing are among the most common barriers to adopting dedicated AR software. For finance teams exploring what cash flow management tools are available, the market has matured considerably in the last three years.
31. The 40% of businesses spending six or more hours per week on AR tasks are, in the majority of cases, the same businesses without automated chasing in place. The correlation is direct: manual processes create the time burden, and the time burden creates the capacity constraints that leave invoices unchased.
32. Businesses that adopt automation get paid faster. Of the 43% of respondents who use AR automation, 71% of those users receive payment within two weeks of the due date. Meanwhile, only 47% of the 57% who rely on manual methods achieve the same result. Businesses that adopt workflow automation show consistently better DSO outcomes than those that do not.
What the data means for your AR process
Seven categories of data, and a clear pattern across all of them: the gap between businesses that collect predictably and those that do not is not primarily explained by customer behaviour. It is explained by process.
Use these questions to apply the benchmarks to your own situation:
1. Is your DSO more than ten days above your stated payment terms? The 2026 data shows that a significant proportion of businesses operate with a DSO that substantially exceeds their terms. The ones closing that gap consistently are those with structured follow-up cadences, not one-off chasing.
2. Are you writing off more than 5% of revenue annually as bad debt? That figure is within range for construction and some professional services, but represents a material process failure for IT, software, or agency businesses where the sector benchmark sits well below it.
3. Are you following up on 100% of overdue invoices every month? If the answer is no, even occasionally, the 76% uplift from consistent follow-up is the single highest-return change available before any technology is introduced.
4. Are you using more than one channel to chase? The channel effectiveness data shows that email alone is frequently insufficient, and that adding phone or SMS touchpoints meaningfully improves collection rates, particularly for invoices over 30 days past due.
If you are above the benchmarks on two or more of these measures, the 2026 data suggests your accounts receivable collection process has a structural gap rather than a one-off collections problem. That is useful information. It means the fix is repeatable, not just situational.
Book a demo to see how Chaser helps you close the gap between what you're owed and what hits your bank account.

Frequently asked questions