























An accounts receivable dashboard is a one-page view of what your customers owe you, how late it is, and how quickly it is turning into cash. A useful one shows six to eight tiles: total receivables, the share that is overdue, overdue balances by age, days sales outstanding (DSO), average days delinquent, collection effectiveness, your largest overdue customers, and open disputes. Who reads it decides what goes at the top. A collector needs today's calls, a finance manager needs the week's trend, and a CFO needs the monthly picture of cash tied up in unpaid invoices.
This guide shows three example dashboards built on the same sample data, the tiles to include and how to calculate each one, and how to build your own in Excel or Google Sheets. It also covers how to read the numbers and act on them.
What is an accounts receivable dashboard?
An accounts receivable (AR) dashboard turns your invoice data into a small set of numbers and charts you can read in a minute. It sits on top of two things you probably have already:
- Your aged receivables report, which lists every open invoice by how overdue it is. The accounts receivable aging report guide explains how to read one.
- Your AR metrics, such as DSO and the collection effectiveness index. The guide to 10 accounts receivable KPIs defines each one in full.
The report is a list and the KPIs are formulas. The dashboard is where you put the few that matter side by side, with a trend and a target, so you can see what changed and decide what to do next.
Dashboards are usually grouped by who uses them and how often. Databricks describes operational dashboards that track activity as it happens, tactical dashboards that track a department over weeks to a quarter, and strategic dashboards that give leaders a high-level view against long-term goals. An AR dashboard can be any of the three, and the examples below cover one of each.
What should an accounts receivable dashboard include?
Start with the eight tiles below. Most teams need all of them somewhere, but no single view needs every one. The formulas follow the Credit Research Foundation's performance measures, which are a common reference for credit and collections teams.
| Tile | What it tells you | How to calculate it | Who watches it |
|---|---|---|---|
| Total receivables | How much customers owe you in total | Sum of every open invoice balance | Everyone |
| Percent overdue | How much of the ledger is late | Overdue balance ÷ total receivables. The CRF's "percent current" is the other side: current receivables ÷ total receivables. | Finance manager, CFO |
| Overdue by age | Where late debt is building up | Overdue balances grouped into 1–30, 31–60, 61–90, and over 90 days past due | Collectors, finance manager |
| DSO | How many days of sales are tied up in unpaid invoices | Ending total receivables × days in the period ÷ credit sales for the period | Finance manager, CFO |
| Best possible DSO and average days delinquent | How much of your DSO comes from late payment rather than your payment terms | Best possible DSO = current receivables × days in the period ÷ credit sales for the period. Average days delinquent = DSO − best possible DSO. | Finance manager, CFO |
| Collection effectiveness index | How much of what you could have collected, you did collect | (Beginning receivables + credit sales − ending total receivables) ÷ (beginning receivables + credit sales − ending current receivables) × 100. Over several months, divide credit sales by the number of months. | Finance manager, CFO |
| Top overdue customers | Whether a few accounts carry most of your risk | Overdue balance by customer, largest first, with the age of the oldest invoice | Collectors, finance manager |
| Open disputes | Invoices that won't be paid until something is fixed | Count and value of disputed invoices, with how long each has been open | Collectors |
Useful extras, once the core is in place, are the percentage of receivables over 90 days past due, cash collected against your forecast, the accounts receivable turnover ratio, and bad debt written off. For how to improve each metric, see the guides to calculating DSO, average days delinquent, and the collection effectiveness index.
The sample data behind the examples
All three examples below use one sample business, so you can see how the same numbers look to different readers. It made $1,170,000 USD of credit sales over the last 90 days, which is $13,000 USD a day. Today it has $520,000 USD of open invoices: $338,000 USD not yet due and $182,000 USD overdue.
The core tiles for the sample business
- DSO: $520,000 × 90 ÷ $1,170,000 = 40 days.
- Best possible DSO: $338,000 × 90 ÷ $1,170,000 = 26 days.
- Average days delinquent: 40 − 26 = 14 days.
- Percent overdue: $182,000 ÷ $520,000 = 35%, so 65% is current.
- Collection effectiveness this month: the month began with $505,000 USD of receivables and added $395,000 USD of credit sales. So ($505,000 + $395,000 − $520,000) ÷ ($505,000 + $395,000 − $338,000) = $380,000 ÷ $562,000 = 68%.
3 accounts receivable dashboard examples
Each example below is an illustration built on the sample data above, not a screenshot of any product. Use them as layouts to copy, then swap in your own numbers.
Example 1: the collector's daily dashboard
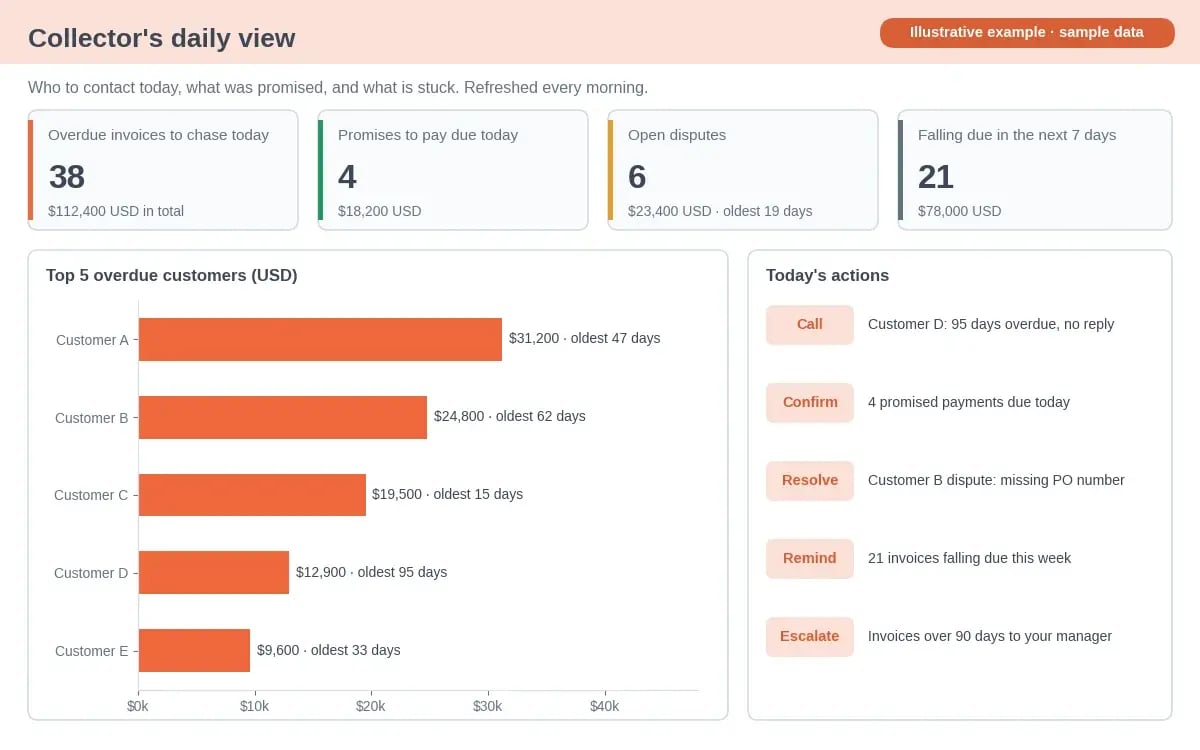
Illustrative example with sample data.
This is an operational dashboard. It answers one question each morning: who do I contact today, and about what? It doesn't need DSO or a six-month trend. It needs a short queue.
- Overdue invoices to chase today, with the total value, so the collector can start with the largest or oldest.
- Promises to pay due today, so a missed promise gets a same-day follow-up rather than a new reminder a week later.
- Open disputes, with the oldest one's age, because a disputed invoice won't pay until someone resolves the query.
- Invoices falling due this week, so a friendly reminder goes out before they become overdue.
- The top overdue customers, with the oldest invoice for each. In the sample, Customer D owes less than Customer A but is 95 days past due, so it goes to the top of the call list.
Refresh it every morning. If the data is a day old, the collector will chase invoices that were paid yesterday.
Example 2: the finance manager's weekly dashboard
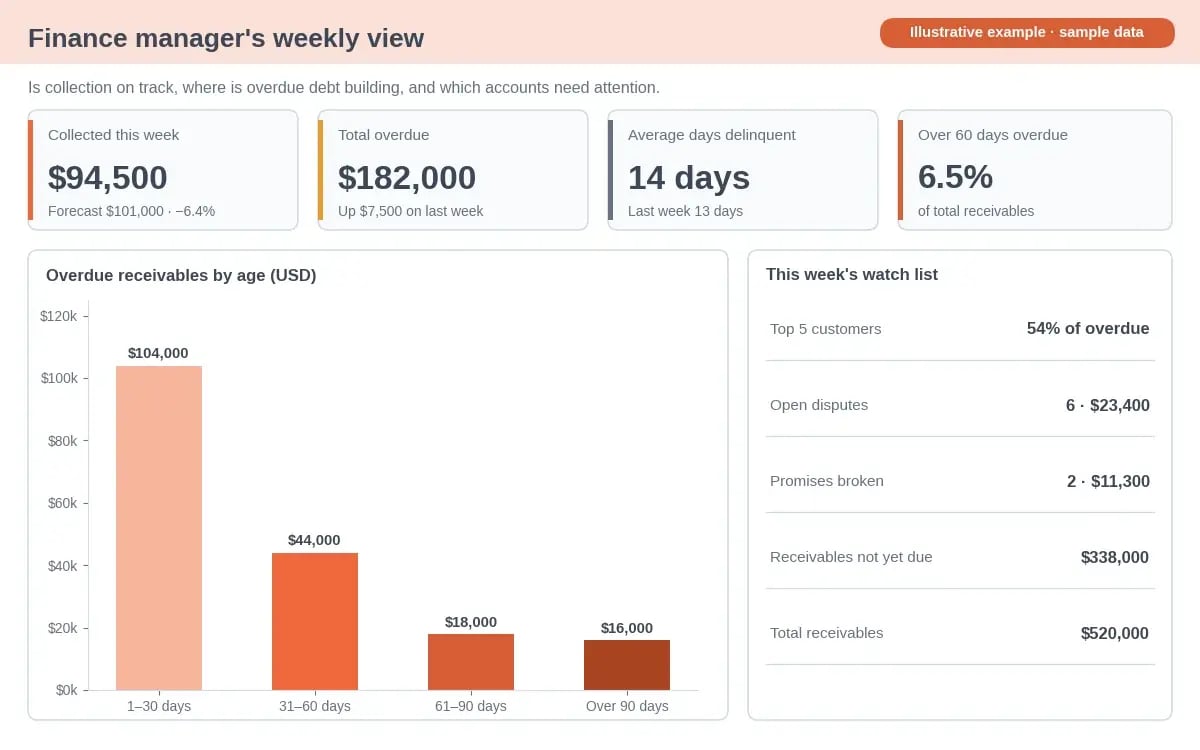
Illustrative example with sample data.
This is a tactical dashboard. It tells the person running the team whether collection is on track this week and where to step in. Every tile compares this week with a forecast or with last week, because a number on its own tells you very little.
- Cash collected against forecast. $94,500 USD came in against a forecast of $101,000 USD, a variance of ($94,500 − $101,000) ÷ $101,000 = −6.4%.
- Total overdue and its movement. Overdue rose by $7,500 USD, from $174,500 USD last week to $182,000 USD.
- Average days delinquent, up from 13 to 14 days. Customers are paying slightly later.
- Overdue by age. $104,000 USD is 1–30 days past due, $44,000 USD is 31–60 days, $18,000 USD is 61–90 days, and $16,000 USD is over 90 days. The last two together are $34,000 USD, or 6.5% of total receivables.
- Concentration. The top five overdue customers owe $98,000 USD, which is 54% of the $182,000 USD overdue. Most of the week's risk sits with five accounts.
Read together, these say the shortfall isn't spread evenly. Receipts missed forecast, lateness ticked up, and five customers hold over half the overdue balance. The action is to review those five accounts with the team this week, rather than to send more reminders to everyone.
Example 3: the CFO's monthly dashboard
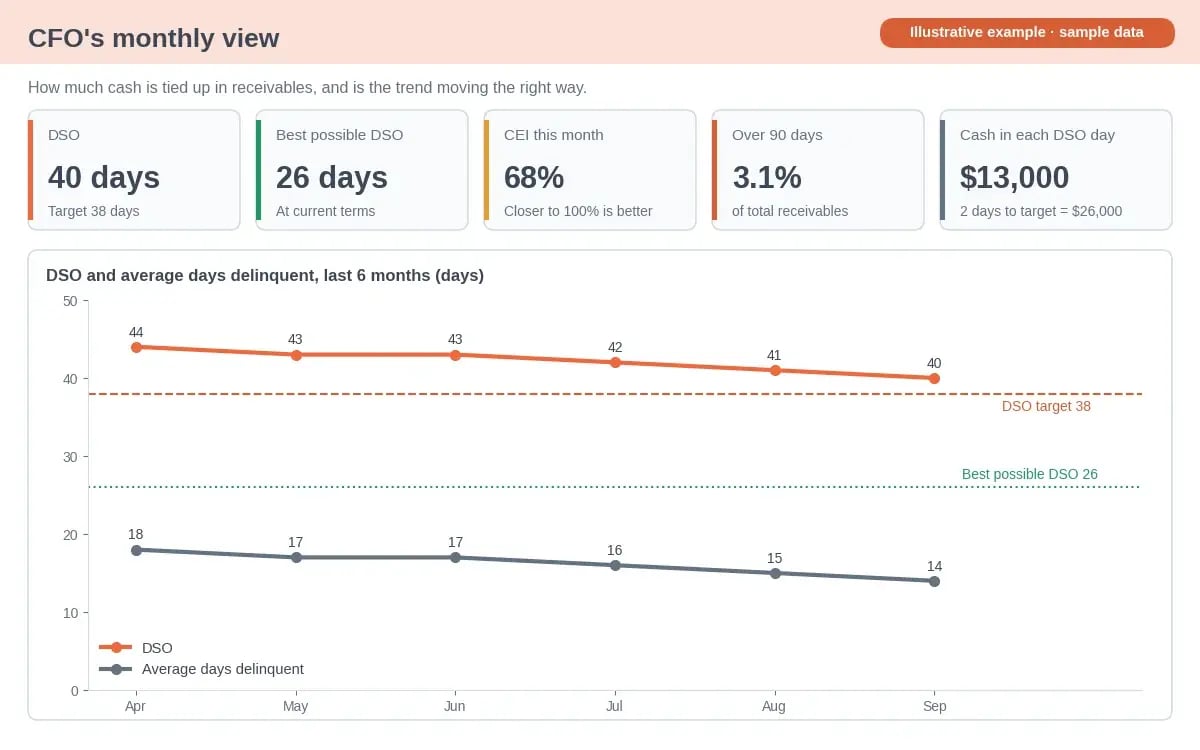
Illustrative example with sample data.
This is a strategic dashboard. A CFO wants to know how much cash is tied up in receivables, whether that is improving, and what it would be worth to improve it further. Fewer tiles, longer trends.
- DSO against target. DSO is 40 days against a target of 38.
- The cash value of a DSO day. At $13,000 USD of credit sales a day, each day of DSO holds about $13,000 USD of cash. Reaching the 38-day target would release about $26,000 USD.
- Best possible DSO beside actual DSO. Best possible DSO is 26 days, so 14 of the 40 days come from late payment. That is the part collections can change without touching payment terms.
- Collection effectiveness and debt over 90 days, at 68% and 3.1% of total receivables. The first shows how thoroughly the team collects. The second is an early warning for bad debt.
- A six-month trend. DSO fell from 44 to 40 days while average days delinquent fell from 18 to 14. Because best possible DSO held at 26, the improvement came from customers paying sooner, not from a change in sales or terms.
A monthly view like this belongs in the board pack. Keep the definitions fixed from month to month, or the trend line means nothing.
| View | Dashboard type | Refresh | Question it answers | Tiles at the top |
|---|---|---|---|---|
| Collector | Operational | Daily | Who do I contact today? | Chase queue, promises to pay, disputes, top overdue customers |
| Finance manager | Tactical | Weekly | Is collection on track, and where should I step in? | Cash vs forecast, overdue movement, aging, average days delinquent |
| CFO | Strategic | Monthly | How much cash is tied up, and is it improving? | DSO trend vs target, best possible DSO, collection effectiveness, debt over 90 days |
Get these views without rebuilding a spreadsheet
Chaser connects to your accounting system, keeps every invoice up to date, and shows your DSO, overdue balances, and chasing activity in one place, so each view is current when you open it.
See how Chaser worksHow to build an accounts receivable dashboard in Excel or Google Sheets
You can build every tile above with standard spreadsheet functions. The steps below work in both Excel and Google Sheets. Use two tabs: an Invoices tab with your data, and a Dashboard tab with the tiles and charts.
Step 1: export one row per invoice
Export open and recently paid invoices from your accounting system into the Invoices tab, one row per invoice, with headers in row 1. You need these columns:
- A: customer
- B: invoice number
- C: invoice date
- D: due date
- E: invoice amount
- F: amount paid
- G: status, where you mark "Disputed" if a customer has raised a query
Keep at least the last 90 days of invoices, paid or not, because DSO needs your credit sales for the period as well as what is still open.
Step 2: add three helper columns
Add these formulas in row 2 of the Invoices tab and copy them down.
| Column | Formula in row 2 | What it does |
|---|---|---|
| H: Balance | =E2-F2 | What is still owed on the invoice |
| I: Days overdue | =IF(H2<=0,0,MAX(0,TODAY()-D2)) | Days past the due date, or 0 if paid or not yet due |
| J: Age bucket | =IF(H2<=0,"Paid",IF(I2=0,"Current",IF(I2<=30,"1-30",IF(I2<=60,"31-60",IF(I2<=90,"61-90","Over 90"))))) | Puts each invoice in one aging bucket |
Step 3: calculate the tiles with SUMIFS
On the Dashboard tab, SUMIFS adds up the balances that meet one or more conditions. It works the same way in Excel and Google Sheets. Put credit sales for the last 90 days in cell B1 first, because both DSO tiles divide by it.
| Tile | Formula |
|---|---|
| B1: credit sales, last 90 days | =SUMIFS(Invoices!E:E,Invoices!C:C,">="&(TODAY()-90)) |
| Total receivables | =SUMIFS(Invoices!H:H,Invoices!H:H,">0") |
| Total overdue | =SUMIFS(Invoices!H:H,Invoices!I:I,">0") |
| Current receivables | =SUMIFS(Invoices!H:H,Invoices!J:J,"Current") |
| Each age bucket | =SUMIFS(Invoices!H:H,Invoices!J:J,"31-60"), changing the label for each bucket |
| DSO | Total receivables × 90 ÷ B1 |
| Best possible DSO | Current receivables × 90 ÷ B1 |
| Average days delinquent | DSO − best possible DSO |
| Open disputes | =SUMIFS(Invoices!H:H,Invoices!G:G,"Disputed",Invoices!H:H,">0") |
Step 4: add charts and a top-customer list
Chart the age buckets as a bar chart, so the older buckets stand out. For the top overdue customers, build a pivot table from the Invoices tab with customer as rows and balance as values, filtered to invoices with days overdue above 0 and sorted largest first. Microsoft explains how to create a PivotTable in Excel, and Google explains how to create and use pivot tables in Sheets.
In Google Sheets, the QUERY function does the same job in one formula:
=QUERY(Invoices!A:I,"select A, sum(H) where I > 0 group by A order by sum(H) desc limit 5 label sum(H) 'Overdue'",1)
Step 5: keep a monthly history tab
A spreadsheet only knows today's balances. To draw a DSO trend or calculate collection effectiveness, you need last month's numbers too. On the last working day of each month, copy total receivables, current receivables, credit sales for the month, DSO, and average days delinquent into a History tab as values, not formulas. Your trend charts read from that tab, and next month's beginning receivables come from it.
Step 6: add targets and thresholds
Give each headline tile a target and color it when it misses. A DSO of 40 days means little alone, but 40 against a target of 38 tells you where you stand. Use conditional formatting to turn a tile amber or red when it moves the wrong way, and keep the thresholds the same from month to month.
How to read an accounts receivable dashboard and act on it
A dashboard earns its place when it changes what your team does next. Look at tiles in pairs, because one number rarely tells you why it moved. The CRF notes that DSO's value lies in helping you tell whether a change in receivables comes from a change in sales or from something else, such as a change in selling terms. Best possible DSO and average days delinquent are what let you tell the two apart.
| What you see | What it usually means | What to do |
|---|---|---|
| DSO up, average days delinquent flat | Best possible DSO rose. Longer terms, a large invoice near month end, or a shift in sales mix. | Check recent terms and large invoices before you blame collections. |
| Average days delinquent rising | Customers are paying later than their terms. | Tighten your reminder schedule and start with the oldest invoices. |
| 61–90 and over-90 buckets growing | Invoices are slipping past routine follow-up. | Call rather than email, escalate, and review your bad debt provision. |
| Collection effectiveness falling | Your team is collecting less of what it could collect. | Look at capacity, open disputes, and accounts nobody has contacted. |
| A few customers hold most of the overdue balance | Concentration risk. One late payer can move the whole month. | Give those accounts a named owner and review their credit limits. |
| Disputes getting older | A process problem, such as missing PO numbers or pricing errors. | Fix the cause upstream in invoicing, then clear the backlog. |
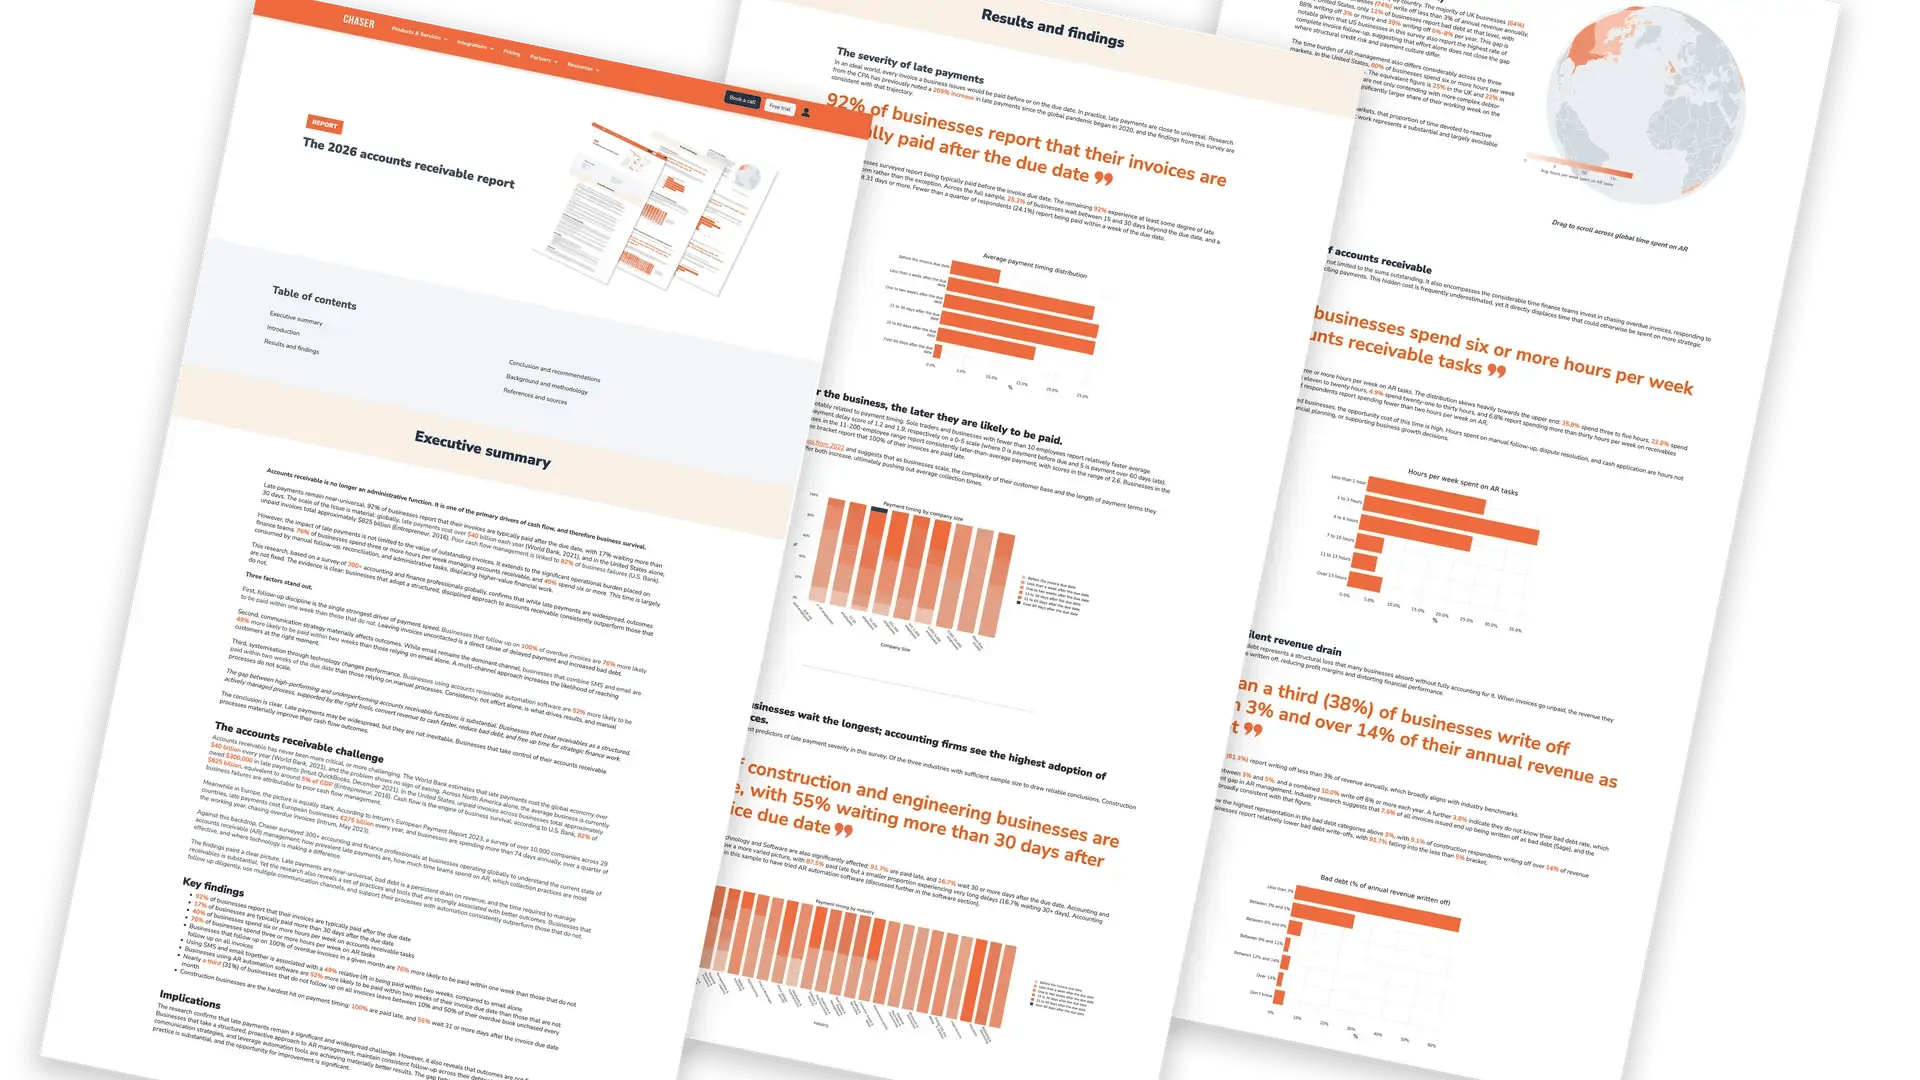
Late payment is the normal case, not the exception. In Chaser's 2026 accounts receivable report, 92% of businesses said their invoices are typically paid after the due date, and 17% said they wait more than 30 days. That is why average days delinquent and the age buckets deserve a place on every view, not just the collector's.
Common AR dashboard mistakes
- Too many tiles. If a tile doesn't lead to an action for the person reading it, move it to another view or drop it.
- No trend or target. A single month's DSO can't tell you whether things are getting better or worse.
- Stale data. A dashboard refreshed monthly can't run a daily chase queue.
- Mixed currencies. Convert every balance to one base currency before you total it, or the totals mean nothing.
- Averages that hide customers. A healthy DSO can sit on top of one large account that is 90 days late. Always pair averages with the top overdue customers.
When does a spreadsheet dashboard stop being enough?
A spreadsheet dashboard is a good way to decide which numbers matter. It becomes hard to keep up when:
- refreshing the export, the formulas, and the history tab takes hours every week
- the numbers are out of date by the time anyone reads them
- several people need the same view, and copies start to disagree
- you can see a problem on the dashboard but can't click through to the invoices and act on them
Chaser connects to your accounting system, so its reports update as invoices are raised and paid. You can follow DSO month by month, see how much is outstanding and overdue, review your largest debtors with the age of what they owe, and track chasing activity by email, SMS, auto-call, and letter against what has since been paid. The overview of Chaser's receivables insights shows what these reports cover.
Two features take the dashboard further. Receivables forecasting shows when cash is likely to arrive, using your live invoice data and each customer's payment history. AI debtor risk insights show which customers are most likely to pay late and who to follow up with first. Together they turn the dashboard from a record of what happened into a plan for what to do next, and free your team to spend its time on the conversations that bring cash in.
FAQs
What is an accounts receivable dashboard?
An accounts receivable dashboard is a one-page view of what customers owe you, how overdue it is, and how quickly it is turning into cash. It usually shows total receivables, the share overdue, overdue balances by age, DSO, average days delinquent, collection effectiveness, the top overdue customers, and open disputes.
What is a good dashboard for accounts receivable?
A good AR dashboard is built for one reader and leads to an action. Collectors need a daily chase queue with promises to pay and disputes. Finance managers need a weekly view of cash collected against forecast, overdue movement, and aging. CFOs need a monthly view of DSO against target, best possible DSO, and collection effectiveness, with a six-month trend.
What KPIs should an accounts receivable dashboard include?
Start with total receivables, percent overdue, overdue balances by age, days sales outstanding, best possible DSO, average days delinquent, the collection effectiveness index, the top overdue customers, and open disputes. Add debt over 90 days, cash collected against forecast, and the AR turnover ratio once the core is in place.
How do I create an accounts receivable dashboard in Excel?
Export one row per invoice with customer, invoice date, due date, amount, and amount paid. Add helper columns for balance, days overdue, and age bucket. Use SUMIFS on a separate dashboard tab to total receivables, overdue balances, and each bucket, then calculate DSO from credit sales for the period. Add a bar chart for the buckets, a pivot table for the top overdue customers, and a monthly history tab for trends.
What are the four types of dashboards?
The four types are operational, analytical, strategic, and tactical. Operational dashboards track activity as it happens, analytical dashboards look for trends and causes over longer periods, strategic dashboards show leaders performance against long-term goals, and tactical dashboards track a department over weeks to a quarter. In AR, a collector's daily view is operational, a finance manager's weekly view is tactical, and a CFO's monthly view is strategic.
What does a CFO dashboard look like for receivables?
A CFO's receivables dashboard has few tiles and long trends. It shows DSO against target, best possible DSO, average days delinquent, collection effectiveness, and the share of receivables over 90 days, with a six-month trend line. It also shows the cash value of one day of DSO, so the CFO can see what reaching the target would release.
What are the 5 C's of accounts receivable management?
The 5 C's usually refer to the 5 C's of credit: character, capacity, capital, collateral, and conditions. Lenders and credit teams use them to judge whether a customer is likely to pay. On a dashboard, they help explain why an account appears among your top overdue customers, and whether to review its credit limit.
See your receivables clearly, without the spreadsheet
Chaser keeps your receivables data current from your accounting system, shows you which customers need attention, and automates the follow-up that brings payments in, so you can plan with confidence.
Start your free trial Speak to an expertKPI definitions follow the Credit Research Foundation's performance measures. Dashboard types follow Databricks. Spreadsheet functions checked against Microsoft Support and Google Docs Editors Help. Late payment figures from Chaser's 2026 accounts receivable report. The dashboard examples use sample data, and every figure was recalculated before publication. Last reviewed 25 September 2026.